Laugharne Estuary Water testing Results-July 2026

Estuary Water Quality: What We Are Seeing at Laugharne
Monitoring results from Frog Rock and Path By Steps, February–July 2026
(Frog Rock is past the sewage works to the right, Path by the Steps is towards the Boathouse where the path turns right and left by first steps up)
About This Monitoring
Since February 2026, volunteers with Laugharne Citizen Science have been testing water quality in the Laugharne estuary at two accessible spots on the bank: Frog Rock and Path By Steps. (We will expand to other sites but the tests take a bit of time to run so focussed on two key sites initiall). Samples are tested with a Hanna Marine multi-photometer, an instrument that gives us lab-quality readings for things like salinity, oxygen, nitrogen and phosphorus compounds, right there on the bank.
To keep our results comparable month to month, we always sample at high tide, on the still-slightly-incoming stage. This means the estuary is at its most consistent, fullest state, so we are comparing similiar tide status.
This page explains what our five rounds of testing (up to 8 July 2026) have shown so far, in plain terms, including one reading that is worth flagging to the community.
The Big Picture: A Normal Estuary Summer
Water temperature and salinity rose steadily and consistently at both sites as the seasons turned, from a chilly 7.5°C in February to around 22°C by early July, with salinity settling into the high-20s to low-30s (parts per thousand) by early summer. Conductivity (a measure of dissolved salts) jumped sharply between June and July, which tracks the salinity rise and reflects more seawater mixing into the estuary at high tide as summer progresses. All of this is exactly what one would expect from a healthy estuary moving through the seasons; nothing here raises concern.
Reading | 26 Feb | 24 Apr | 5 Jun | 8 Jul |
Water temp (°C), Frog Rock | 7.5 | 10.8 | 16.0 | 22.2 |
Salinity (ppt), Frog Rock | 14.4 | 29.2 | 28.9 | 29.0 |
Table 1: Seasonal warming and salinity at Frog Rock, a pattern mirrored closely at Path By Steps.
Oxygen: A Seasonal Dip, With One Site Dropping Faster
Dissolved oxygen naturally falls as water warms, and both sites followed that pattern through the summer. Path By Steps, however, dropped more sharply than Frog Rock in July, from 10.5 mg/L in June to 7.2 mg/L: the steepest single-month fall we have recorded, and noticeably lower than Frog Rock's 9.3 mg/L on the same visit. This level is not dangerously low on its own, but paired with the ammonia reading below, it points to something specific happening at that site around the time of testing.
Spotlight: The Ammonia Reading at Path By Steps
Our most notable result this round was at Path By Steps in July, where ammonia measured 2.5 mg/L: more than ten times higher than every previous reading at that site (which had sat between 0.08 and 0.17 mg/L since April). Frog Rock, tested the same day, showed no ammonia at all.
It is worth being clear that 2.5 mg/L, while a sharp jump for this site, is not a level considered acutely dangerous to fish or other wildlife in an estuarine setting, and it was not sustained. We returned the following day to check, and the reading at Path By Steps had already fallen to 0.42 mg/L: still somewhat above its usual baseline, but a drop of more than 80% within 24 hours.
What does this tell us? A spike this large that mostly clears within a day looks like a short, localised pulse rather than an ongoing problem: for example, a small amount of waste, a wash of organic matter, or a brief discharge reaching the water right around Path By Steps at the time we sampled, before dispersing with the tide. It is a useful reminder that water quality in an estuary can change quickly over short distances and short timeframes, which is exactly why regular, side-by-side monitoring of this kind matters.
We will keep sampling both sites at the same state of tide each round and will report back should the pattern recur. If you walk this stretch of the bank near Path By Steps and notice anything unusual entering the water, we would be grateful to hear from you.
Other Things We Noticed
A shared nitrite blip in June
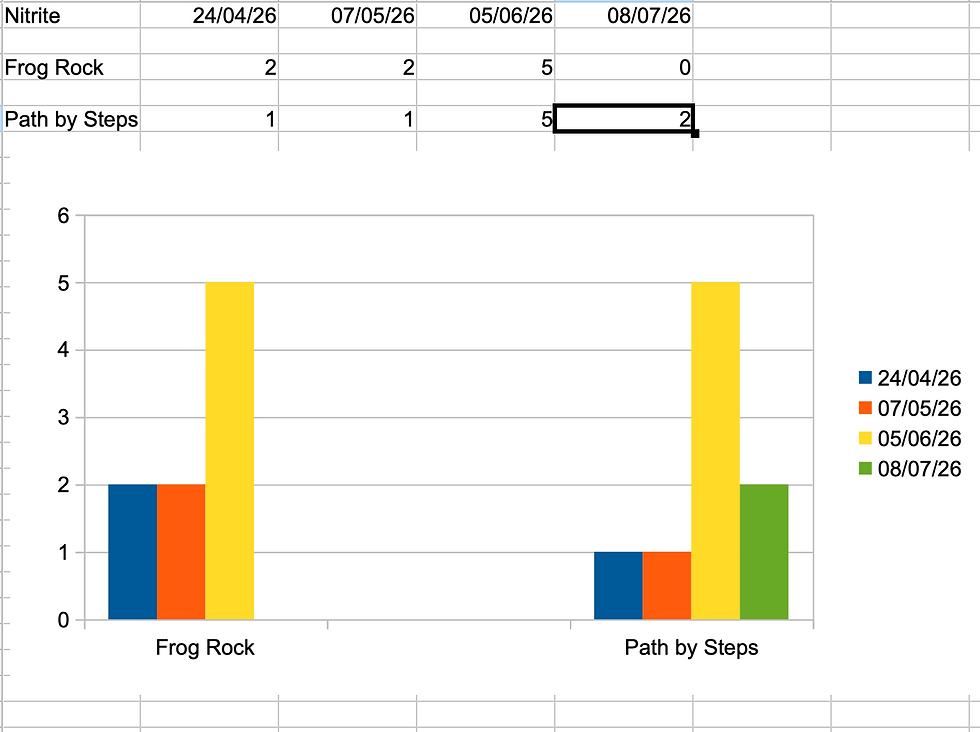
Both sites showed a nitrite spike in June (5 mg/L at each, compared with 0–2 mg/L in other months), and both had returned to low levels by July. As it appeared at both sites at once, this looks like a shared, temporary event across the whole stretch, possibly linked to rainfall or run-off, rather than something specific to one location.
Nitrate and phosphate moving differently at each site
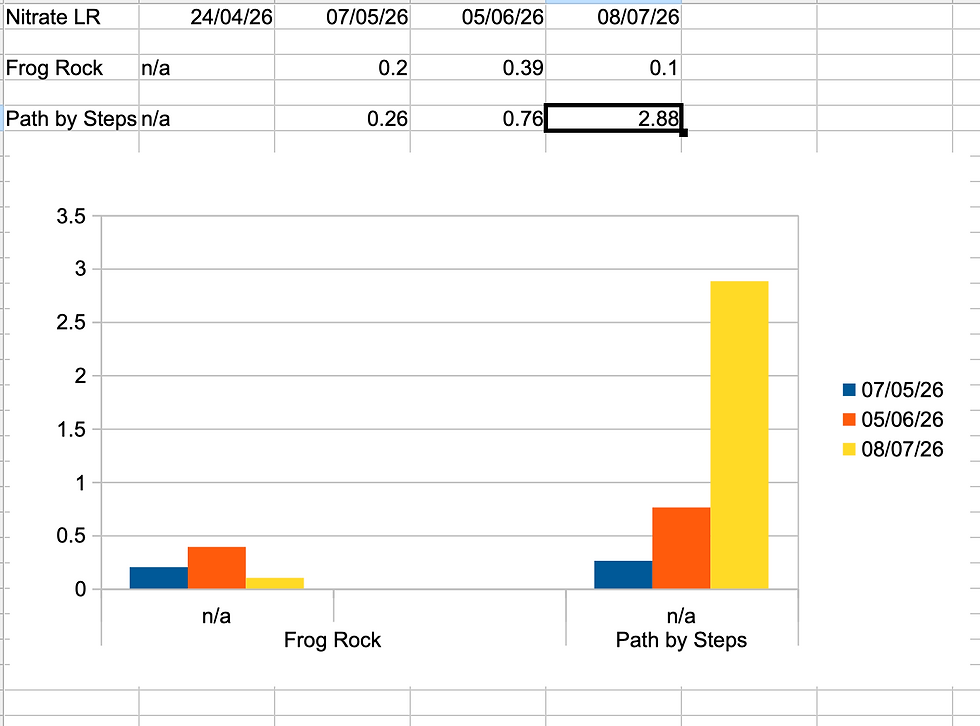
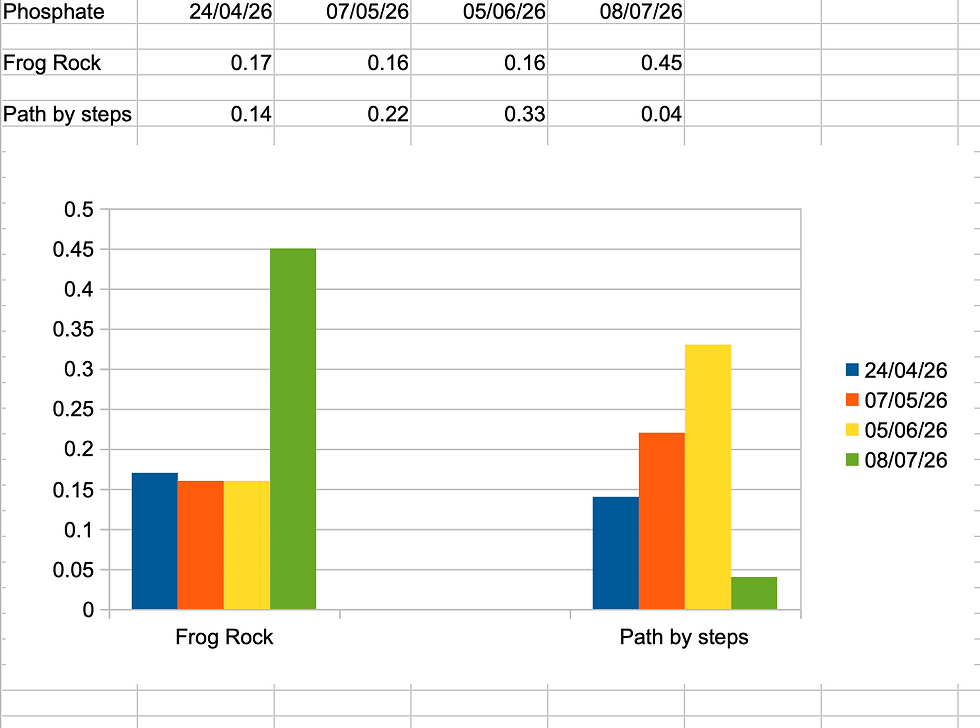
At Path By Steps, nitrate rose steadily from May onwards and jumped to 2.88 mg/L in July, while phosphate at the same site actually fell sharply that month. Frog Rock showed the opposite pattern in July, with phosphate rising and nitrate staying low. These opposing movements, at the same time, suggest the two locations are picking up somewhat different, localised influences, which is something we will keep an eye on as the data set grows.
What Happens Next
This is still an early, five-round data set, so we are being careful not to over-read single spikes, but we believe it is important to share results transparently, including the ones that warrant a closer look. We will continue monthly testing at both sites at the same state of tide, and will publish updates here as the picture develops.
Interested in getting involved with testing, or do you have information about activity near Path By Steps? Please get in touch with Laugharne Citizen Science; we are always glad to have more eyes (and hands) on the estuary.

*this high ammonia reading at path by the steps had dropped to 0.42 the next day suggesting a one off event.


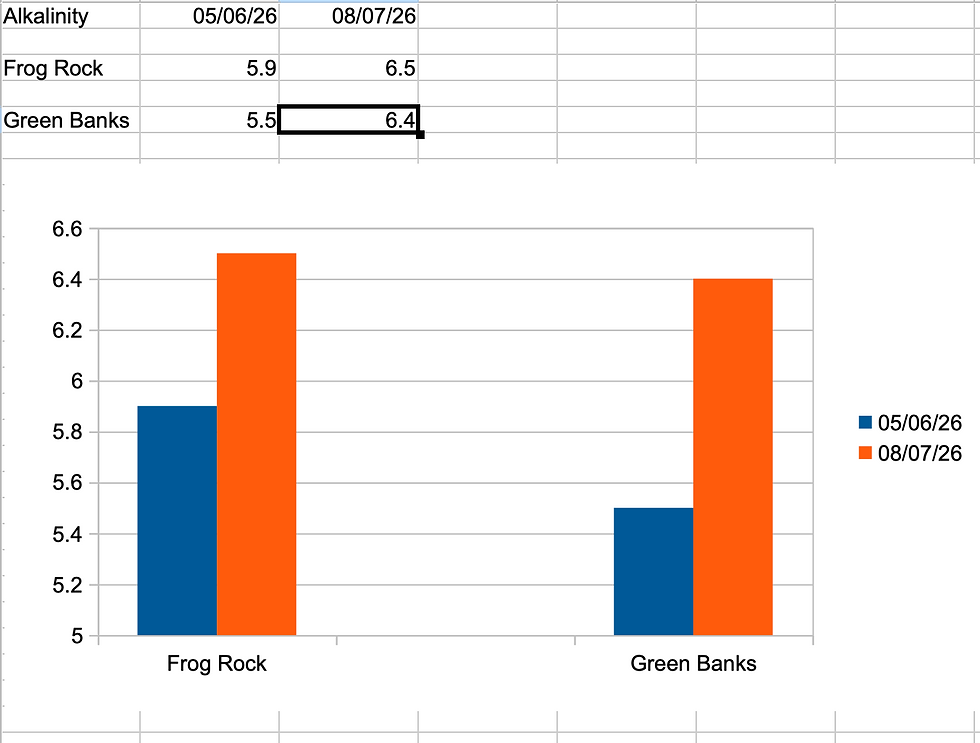


Some results were just two months. New equipment donated.


Comments